


EXECUTIVE SUMMARY
- At the centre of the US-China trade war are the semiconductor chip and green industries.
- ASEAN is clearly benefiting from the resultant reconfiguration of the global supply chains in these two industries in terms of trade, value addition and foreign direct investment, at least in the short run. However, these benefits can be more than offset by the greater disruption to the global supply chains should US-China tensions continue to escalate.
- Its high trade reliance on China while having the US as its largest investor (by far) and key source of technology transfers puts ASEAN in an increasingly precarious situation should the US-China supply chain decoupling intensifies.
- Forcing ASEAN to choose sides – whether to be in the US or China supply chain system – will be impossible and disruptive, and ASEAN should continue to take the pragmatic approach and reject choosing sides.
* Aufa Doarest is Private Sector Specialist at the World Bank Group’s Finance, Competitiveness and Innovation and Maria Monica Wihardja is Economist and Visiting Fellow at ISEAS – Yusof Ishak Institute and Adjunct Assistant Professor at the National University of Singapore.
ISEAS Perspective 2024/35, 17 May 2024
INTRODUCTION
Interdependence within the global supply chain has been exacerbated by the growing dependence for intermediate inputs on only a few firms and a few countries (Pangestu, 2023). The semiconductor industry and the green technology industry are two examples of highly concentrated supply chains where firms from East Asia (e.g., China, Taiwan and South Korea) are now the dominant suppliers (Miller, 2022; Nguyen-Quoc, 2023).
The heightened dependence of the US on China has raised geopolitical rivalry between the two countries and driven the reconfiguration of supply chains. Countries and companies now seek to ‘decouple’, ‘diversify’ and ‘de-risk’ their supply chain configuration away from their adversaries. Consequently, supply chains in Asia are undergoing major changes.
At the country level, a number of strategies are being adopted, including re-routing trade flows through intermediary countries; home-shoring investment through investment subsidies and tax credits; and increasing self-reliance through import substitution and research and development (R&D). At the corporate level, multinational companies (MNCs) in Asia and worldwide are adapting by adopting the ‘China Plus One’ or ‘China Plus Two or Three’ model to broaden their supply base outside China while maintaining a presence in China (Nguyen-Quoc, 2023).
This essay reviews and analyses how ASEAN economies have been impacted by the changing dynamics in the global supply chain. We focus on two industries, namely the semiconductor industry and the electric vehicle (EV) industry,[1] and look at the impacts from three angles: trade, investment and R&D.
THE US INDUSTRIAL POLICY IN CHIP AND GREEN TECHNOLOGY
Since 2018, during the Trump administration, the US has been restricting the exports of “emerging and foundational technologies” to entities abroad whenever those technologies are “essential to the national security of the US” (Bradford, 2023). This started with the Export Control Reform Act of 2018 enforced through the maintenance of a Commerce Control List and a licensing system as well as a narrower export control instrument known as the Entity List. Although the idea was to restrict exports exclusively for advanced technologies that could endanger national strategic interest – dubbed as the ‘small yard, high fence’ strategy – these export restrictions were later expanded in terms of both technologies and entities. For example, in 2020, the 2018 export restrictions to ban Huawei’s access to semiconductors were extended to cover all foreign technology companies (instead of only US firms) that use US chipmaking equipment and software tools.
In August 2022, the CHIPS (Creating Helpful Incentives to Produce Semiconductors) and Science Act allocated USD280 billion to catalyse investments in domestic semiconductor R&D and manufacturing capacity. In October 2022, a set of export restrictions were issued to cut off China’s access to advanced AI chips and choke point technologies[2] (Ing and Markus, 2023). Later, these export restrictions were expanded into restrictions on direct investment (Shalal and Freifeld, 2023) and financial investment (private equity and venture capitals) (Siqi, 2024), as well as restrictions on individuals who hold US passports from working for Chinese chip companies (Lin and Hao, 2022).
In a spirit similar to the CHIPS and Science Act, in August 2022, the US also signed into law the Inflation Reduction Act (IRA) to catalyse investment in R&D and domestic manufacturing capacity in leading-edge green technologies, including carbon capture and storage as well as EV (Badlam et al, 2022b).[3] The law will direct USD400 billion into a mix of tax incentives, grants, and loan guarantees.
The concentration of green technology production and the critical minerals associated with it in China—and in a few Chinese firms—has sounded an alarm bell for the US. For example, China dominates 75 percent of Solar Photovoltaic technology and battery manufacturing compared to the small share the US has of only 5 percent in the production of both technologies (Li and Zhao, 2023). Similarly, China commands 55 percent of wind technology manufacturing.
The IRA is the US’ biggest and most significant national policy to combat climate change. However, it is unclear whether the IRA will leave any room for collaboration in low-carbon technologies where China is a major player, or lead to race-to-the-bottom protectionist industrial policies and strategic competition similar to that now found in the chip industry (Li and Zhao, 2023). Given the high concentration of green technology in China, diversification of trade sources is commendable. However, focusing on where the green technologies are built could risk slowing down the low-carbon transition in the US and globally.
THE CHALLENGES OF SUPPLY CHAIN RECONFIGURATION
At the centre of the US-China trade war and supply chain reconfiguration are chip and green technologies. Chip production-related activities, including assembling, packaging and testing, account for a significant share of the GDP and/or exports of ASEAN countries such as Malaysia, Singapore, Thailand and the Philippines (EDB, 2022a; EDB, 2022b).[4]
Supply chain reconfiguration in this context refers to aspects of production being shifted to countries or firms which are not necessarily the most competitive and efficient, due to geopolitical and national security factors. The new countries and firms may even have siloed technologies and production processes that are disconnected from others in the supply chain.
The impacts of supply chain reconfiguration on ASEAN economies can be strongly noted in three areas, namely (1) trade diversion through several intermediary countries to avoid goods flowing directly from China to the US, (2) relocation of FDI, (3) Research and Development (R&D) activities. The following sections discuss these separately.
TRADE [5]
China’s dominance as the world’s manufacturing superpower (Baldwin, 2024) is partly reflected in a significant increase in China’s export of EV (including Completely Built-Up and Completely Knocked Down cars but not parts such as batteries) and chips between 2017 and 2022. Within that period, China’s export of chips almost doubled, from USD 72 billion to USD129 billion, while China’s export of EV increased by almost 13 times, from USD2 billion to USD25 billion (Figure 1 and Figure 2).
Figure 1: China’s export and import of chips (in million USD)

Source: World Integrated Trade Solution (WITS, accessed February 2024), authors’ calculations
Figure 2: China’s export and import of EVs (in million USD)

Source: World Integrated Trade Solution (WITS, accessed February 2024), authors’ calculations
The US-China tech war, especially the escalating restrictions on China’s access to US technologies that started in 2018, are reflected in the trade in chips between the two countries in 2022. After an increasing trend since 2017, China’s import value of chip from the US declined from USD15.1 billion in 2021 accounting for 10.2 percent share of China’s total import of chips, to USD11.6 billion in 2022 accounting for 8.0 percent share (Table 1). Mirroring China’s import value decline is US’ export value decline of chips to China.
Table 1: US’ export of chips to China and China’s import of chips from the US
Source: World Integrated Trade Solution (WITS, accessed February 2024), authors’ calculations.
Note: There are multiple reasons for discrepancies in exports and imports data so that they don’t always mirror each other. See: https://wits.worldbank.org/wits/wits/witshelp/content/data_retrieval/T/Intro/B2.Imports_Exports_and_Mirror.htm
The US decision to diversify its trading partners and move away from China affects international trade in chips. First, China’s chips export destination pattern has slightly shifted. The share of China’s chips export to the US dropped from 19 percent in 2018 to 11 percent in 2022. At the same time, the share of China’s chips export to ASEAN countries increased slightly from 18 percent in 2018 to 20 percent in 2022 (Table 2). While the changes in the destination pattern may be due to lack of domestic demand in the US, the positive trend of US import of chips, increasing from USD79.7 billion in 2018 to USD87.2 billion in 2022, reveals that US domestic demand has actually gotten stronger. It is predicted that the demand for chips will continue to increase as AI, robots and EV become the new normal in people’s everyday lives.
Table 2: Chips export shares of China, ASEAN and Mexico (%)
| China’s Chips Export Share (%) | ASEAN’s Chips Export Share (%) | Mexico’s Chips Export Share (%) | |||
| China to ASEAN | China to Mexico | China to USA | ASEAN to USA | Mexico to USA | |
| 2017 | 17.4 | 1.3 | 17.9 | 12.0 | 69 |
| 2018 | 18.4 | 1.4 | 19.2 | 9.0 | 65 |
| 2019 | 19.5 | 1.3 | 16.6 | 9.8 | 58 |
| 2020 | 21.5 | 1.3 | 12.7 | 11.9 | 60 |
| 2021 | 20.2 | 1.4 | 10.4 | 11.5 | 65 |
| 2022 | 20.1 | 1.6 | 11.1 | 14.0 | 67 |
Source: World Integrated Trade Solution (WITS, accessed February 2024), authors’ calculations
Second, this export diversion is reflected in the import pattern of chips. The US import share of chips has shown an increasing reliance on ASEAN and a decreasing reliance on China (Figure 3). Both ASEAN and China accounted for 34 percent of US chips import in 2017; but while ASEAN’s share increased to 48 percent in 2022, China’s share was halved to 17 percent. Meanwhile the share of Mexico in US chips imports has barely changed while the share held by other countries has increased by 4 percentage points in the same period. This shows that ASEAN is clearly benefiting from US’ import diversion away from China.
Figure 3: US import of chips

Source: World Integrated Trade Solution (WITS, accessed February 2024), authors’ calculations
Unlike the chips trade, the trend of EV trade between the US and China continued to be robust in terms of value until 2022 but declined in terms of reliance (or share) (Table 3). The US used to account for 28.1 percent of China’s export in EVs but this fell to only 7.9 percent in 2022. At the same time, China had accounted for 52.5 percent of US’ import in EV but this declined to 12.8 percent in 2022.; ASEAN’s export of EVs has been increasingly going to the US (Table 4) while ASEAN’s import of EVs has been increasingly coming from China (Figure 4). The two-wheeler EV has been driving the increase in ASEAN’s export of EVs to the US. The main exporter before the COVID-19 pandemic was Vietnam.
Table 3: US’ import from China and China’s export to the US of EVs
| China’s export of EVs to the US | US’ import from China of EVs | |||
| Value (in USD billion) | Share (%) | Value (in USD billion) | Share (%) | |
| 2017 | 0.3 | 16.6 | 0.1 | 23.9 |
| 2018 | 0.7 | 28.1 | 0.4 | 52.5 |
| 2019 | 0.7 | 21.4 | 0.4 | 20.7 |
| 2020 | 1.0 | 20.4 | 0.9 | 33.4 |
| 2021 | 1.8 | 12.6 | 1.0 | 15.3 |
| 2022 | 2.0 | 7.9 | 1.6 | 12.8 |
Source: World Integrated Trade Solution (WITS, accessed February 2024), authors’ calculations.
Note: There are multiple reasons for discrepancies in exports and imports data so that they don’t always mirror each other. See: https://wits.worldbank.org/wits/wits/witshelp/content/data_retrieval/T/Intro/B2.Imports_Exports_and_Mirror.htm
Table 4: EV export value (in USD million) and share (%)
| China to ASEAN | China to Mexico | China to USA | ASEAN to USA | Mexico to USA | ||||||
| Value | Share | Value | Share | Value | Share | Value | Share | Value | Share | |
| 2017 | 136.7 | 7.0 | 7.8 | 0.4 | 326.0 | 16.6 | 0.1 | 1.1 | 182.4 | 98.3 |
| 2018 | 119.9 | 4.5 | 12.1 | 0.5 | 746.3 | 28.1 | 4.7 | 9.1 | 43.3 | 64.5 |
| 2019 | 202.3 | 6.3 | 21.7 | 0.7 | 685.5 | 21.4 | 31.6 | 24.5 | 20.8 | 65.2 |
| 2020 | 200.0 | 3.9 | 13.8 | 0.3 | 1,033.9 | 20.4 | 43.8 | 28.1 | 24.9 | 36.7 |
| 2021 | 409.5 | 3.0 | 32.0 | 0.2 | 1,750.5 | 12.6 | 74.6 | 33.2 | 1,734.2 | 43.7 |
| 2022 | 1,073.6 | 4.2 | 80.1 | 0.3 | 2,017.4 | 7.9 | 243.9 | 51.2 | 2,341.5 | 54.8 |
| Note: Value in USD million. Share in %. | ||||||||||
Source: World Integrated Trade Solution (WITS, accessed February 2024), authors’ calculations
Figure 4: Source countries for ASEAN’s import of EVs (%)

Source: World Integrated Trade Solution (WITS, accessed February 2024), authors’ calculations
In short, while the US-China trade in chips shows signs of ‘decoupling’ (reduced trade values), the US-China trade in EVs shows signs of ‘diversifying’ (reduced trade shares) but not ‘decoupling’.
VALUE ADDITION
Looking at trade in total value or volume may not give the complete picture of trade diversion. China might divert its trade to the US through intermediary countries to avoid sanctions or higher tariffs placed on goods coming directly out of China and exports coming out these intermediary countries to the US may actually be high in Chinese content.
It is therefore important to also look at trade in value-added (TiVA) data of goods and services, which measure the value added by each country in the production of goods and services that are consumed worldwide (gross production minus the purchased intermediates). We use the OECD TiVA data used in Baldwin (2024) to analyse the changes in ASEAN participation in the global value added:
- ‘Foreign Production Exposure: iMport side (FPEM)’: Share of imported input from a source country out of all industrial inputs (including domestically source inputs) used by a country on a scale of 0 to 100. Industrial inputs extend beyond the manufacturing sector and includes the agriculture and service sectors as well. The higher the index, the more reliant (and exposed) a country is to the source country on the production side.
- ‘Foreign Production Exposure: eXport side (FPEX)’: Share of a country’s manufactured production from the manufacturing sector that is exported to a particular partner on a scale of 0 to 100. The higher the index, the more reliant (and exposed) a country is to the destination country on the sales side.
Data for ASEAN are taken as the average of all ASEAN countries. Instead of looking at reliance of trade in value-added in the chips and EV industries, we look at reliance of trade in value-added in the whole economy. With a lag in the OECD TiVA data (the latest TiVA data is for 2020),[6] we may not be able to see the impacts of the more current policies such as the CHIPS and Science Act and the Inflation Reduction Act. However, we can observe a longer-term trend of trade in value-added, including China’s increasing dominance and ASEAN’s increasing participation in global value added.
The US reliance on China’s industrial inputs skyrocketed since the mid-1990s to decline since 2015, albeit with a slight up-tick in 2022 (Figure 5a). Despite this decline, in 2020, US’ reliance on China’s industrial inputs was still three times higher than China’s reliance on US industrial inputs. On the sales side, China’s reliance on the US was more than 17 times higher than US reliance on China in 1995, but the ratio declined since the early 2000s to two times in 2020 (Figure 5b).
Figure 5a and 5b: US-China reliance on the production side, and US-China reliance on the sales side

Source: OECD TiVA (updated 2023, accessed February 2024), authors’ calculations
How has the participation of ASEAN economies in global value added changed?
China replaced the US as the dominant industrial input source for ASEAN countries in 2003 (Figure 6a). In 1995, ASEAN’s reliance on US industrial inputs was three times ASEAN’s reliance on China inputs. In 2020, ASEAN’s reliance on China’s industrial input was more than five times ASEAN’s reliance on that of the US. Similarly, China replaced the US as the dominant industrial output destination for ASEAN countries in 2011 (Figure 6c). In 1995, ASEAN’s reliance on the US market was more than eight times ASEAN’s reliance on that of China. In 2020, this flipped, with ASEAN’s reliance on China’s market coming close to 1.5 times ASEAN’s reliance on that of the US. Conversely, China’s reliance on ASEAN’s industrial inputs and market is increasing and is higher compared to US reliance on those of ASEAN (Figure 6b and Figure 6d).
Intensification of ASEAN’s reliance on both China’s industrial inputs (production side) and the US market (sales side) since 2016 indicates ASEAN’s growing role as an intermediary region for Chinese goods to the US. This is supported by evidence at the country level with the correlation between Vietnam’s exports to the US and Vietnam’s imports from China doubling from 0.4 in 2020 to more than 0.8 in 2024, where 1 shows perfect correlation (The Economist, 2024).

Source: OECD TiVA (updated 2023, accessed February 2024), authors’ calculations
FOREIGN DIRECT INVESTMENT
General FDI trends
Export-oriented FDI inflow positively correlates with the trade pattern. As the trade war intensifies, trade through intermediary countries and the investment inflow going to these intermediary countries surge, including investment to build new manufacturing factories. International investors have relocated or diversified their production locations away from China and sought other Asian economies as destination for FDI to de-risk their businesses from uncertainties arising from geopolitical tensions, pandemic-induced supply chain disruptions, and rising production costs in some countries while seeking potential gains from the new global value chain and emerging sectors such as chips and EVs.
The ASEAN region is a major beneficiary of this FDI relocation (ASEAN and UNCTAD, 2023). FDI inflow to ASEAN-6 (Malaysia, Singapore, Indonesia, Thailand, Vietnam, and the Philippines) reached an all-time high of USD227 billion in 2022 and surpassed the FDI inflow to China (Figure 7). Meanwhile, FDI into China fell to its 30-year low in 2023.
Figure 7: FDI (in USD mn) in China and ASEAN-6
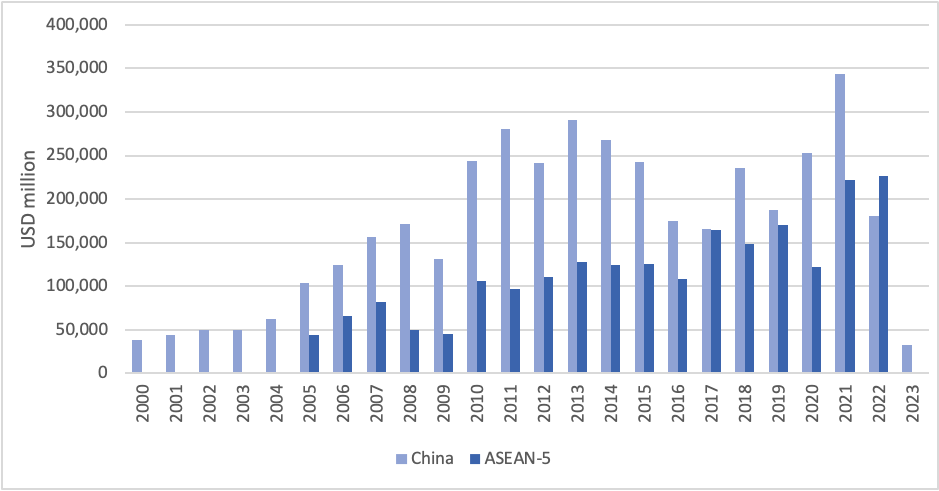
Source: CEIC (accessed February 2024); authors’ calculations.
Note: ASEAN-6 is used instead of ASEAN since other ASEAN countries’ investment data is not up to date.
Reconfiguration of supply chain-related FDI in ASEAN can be categorized into two groups:
- Existing investors expanding their production capacities in the region.
- New investors with/without plant/business presence in China establishing in the region while keeping their presence in China, including Chinese and Taiwanese firms (e.g., the ‘China Plus One’ strategy), or moving their plant and businesses out of China because of the intense US-China conflict.
EVs, EV batteries, electronics and chips, data centres, and the digital economy received robust new and expanded investment in 2022 (ASEAN and UNCTAD, 2023). Manufacturing investment notably scored much stronger growth than in previous years with its share in total FDI in ASEAN rising more than three folds from just nine percent in 2020 to 28 percent in 2022.
FDI by Industry
The electronics and electrical industry accounted for more than 70 percent of new manufacturing investments at USD37 billion, with chips and electronic components alone making up 27 percent of the 70 percent (ASEAN and UNCTAD, 2023), reaching close to USD9.5 billion in 2022, six times the annual average between 2010 and 2019.
Besides chips and electronic components, the ASEAN region also attracted strong investment in EVs and EV battery production as well as charging stations. New investment in batteries rose by 656 percent in 2022 compared to 2021 to USD8.4 billion, accounting for 23 percent of new manufacturing investment (ASEAN and UNCTAD, 2023). Chips, electronic components and battery production combined accounted for half of new manufacturing investment in 2022. FDI in EV-related sectors shot up from USD2.1 billion in 2019 to USD18.1 billion in 2022 (ASEAN and UNCTAD, 2023).
FDI by source and host countries
It is predicted that FDI flows are being increasingly concentrated to countries that are geopolitically aligned with the investor (Ahn et al, 2023). The US, which recently upgraded its bilateral economic relationship with Singapore, Vietnam and Indonesia, was the largest investor in ASEAN with investment reaching USD37 billion in 2022.[7] It was also the largest investor by far in the manufacturing and financial sector. Japan was the third largest investor after intra-ASEAN investment. Japanese FDI in ASEAN was concentrated in the transportation and storage industry, accounted for 88 percent of investment in the industry, reflecting its interest in the automotive industry, including EVs. FDI from China fell by USD1 billion to USD16 billion in 2022, with investment predominantly being in infrastructure projects, EV-related activities and the digital economy.
How ASEAN countries benefit from the reconfiguration of the global supply chain depends on their specialized capabilities (Varas et al, 2021). For example, outsourced chip, assembly and testing (OSAT) firms have been diversifying their global footprints in Southeast Asia such as in Malaysia, Vietnam and the Philippines. Meanwhile, Singapore captured new investment in new chips factories and hosted one of the world’s leading global semiconductor research institutions, A*STAR, whose research goes beyond chip technology.
RESEARCH & DEVELOPMENT
The recent trade and technology war between the US and China has spurred R&D subsidies. The CHIPS and Science Act of 2022 directs USD200 billion of its total USD280 billion spending for scientific R&D and commercialization into chips (Badlam et al, 2022a). Similarly, the Inflation Reduction Act of 2022 increased and expanded tax credits for R&D activities including to jump-start R&D and commercialization of cutting-edge green technology such as EV (Badlam et al, 2022b). In the same year, China upgraded the country’s tax credits for investment in semiconductor R&D from existing chips subsidies worth at least USD150 billion. The R&D subsidies in chips and green technology spill over to other countries including the European Union and Japan. Although most R&D investment is made to unlock financial constraints in the upstream and midstream industries, it usually has a chain synergy effect that catalyses R&D in the downstream industry and the overall innovation ecosystem.
How does the R&D subsidy race affect ASEAN economies? First and foremost, most ASEAN countries do not have the capability (e.g., human capital, physical capital, and regulatory ecosystem) to do cutting-edge R&D. Second, not all ASEAN countries can afford to engage in a subsidy race. Third, technology has become synonymous with geopolitical alignment and trust is a prerequisite to technology transfers. The US as the largest investor in ASEAN is key to bringing new technology to ASEAN as investment often times comes with technology transfers. At the same time, countries with a good reputation in patent and copyright law have an additional advantage in getting R&D investment.
ASEAN economies will not and should not rush into the R&D subsidy race and could instead promote an ASEAN R&D hub, perhaps located in Singapore, as a way to create a production ecosystem in the region.
CONCLUSION
ASEAN’s high trade reliance on China while having the US (by far) as its largest investor and key source of technology transfers puts it in an increasingly precarious situation if US-China supply chain decoupling intensifies. Forcing ASEAN to choose sides – to be in the US or China supply chain system – will be impossible and disruptive, and ASEAN should continue to take the pragmatic approach and reject that option. In the short run, some ASEAN countries are benefiting from the relocation of global supply chains as shown by trade, value addition and FDI data, but the high level of interdependence of global supply chains and the manufacturing hubs in China suggests that these benefits could be more than offset in the long term by the greater disruption to the global supply chains if the US-China tensions continue to escalate.
REFERENCES
Ahn, J., Carton, B., Habib, A., Malacrino, D., Muir, D. and Presbitero, A., 2023. ‘Geoeconomic fragmentation and foreign direct investment’. Chapter 4, IMF World Economic Outlook: A Rocky Recovery. IMF Publication.
The ASEAN Secretariat and United Nations Conference on Trade and Development (ASEAN and UNCTAD). 2023. A Special ASEAN Investment Report 2023. International Investment Trends: Key Issues and Policy Options. Jakarta: ASEAN Secretariat.
Badlam, Justin, S. Clark, S. Gajendragadkar, A. Kumar, S. O’Rourke, and D. Swartz. 2022a. ‘The CHIPS and Science Act: Here’s what’s in it’. McKinsey & Company Publication. Link: https://www.mckinsey.com/industries/public-sector/our-insights/the-chips-and-science-act-heres-whats-in-it#/
Badlam, Justin, J. Cox, A. Kumar, N. Mehta, S. O’Rourke, and J. Silvis. 2022b. ‘The Inflation Reduction Act: Here’s what’s in it’. Link: https://www.mckinsey.com/industries/public-sector/our-insights/the-inflation-reduction-act-heres-whats-in-it
Baldwin, Richard. 2024. ‘China is the World’s Sole Manufacturing Superpower: A Line Sketch of the Rise’. CEPR Publication. Link: https://cepr.org/voxeu/columns/china-worlds-sole-manufacturing-superpower-line-sketch-rise
Bradford, Anu. 2023. Digital Empires: The Global Battle to Regulate Technology. Oxford University Press.
Curran, E., S. Donnan, M. Cousin, N.D. Tu Uyen, Q. Nguyen, M. Martewicz, M. Averbuch, B. Murray, A. Lee, G. Sihombing, and C. Jiao. ‘These Five Countries Are Key Economic ‘Connectors’ in a Fragmenting World’. Businessweek, Bloomberg New Economy.
Dahlman, Abigail, and Mary E. Lovely. 2023. ‘US-led Effort to Diversity Indo-Pacific Supply Chains Away from China Runs Counter to Trends’. Peterson Institute for International Economics (PIIE) Publication. Link: https://www.piie.com/blogs/realtime-economics/us-led-effort-diversify-indo-pacific-supply-chains-away-china-runs-counter
Ebrahimi, Arrian. 2023. ‘China Boosts Semiconductor Subsidies as US Tightens Restrictions’. The Diplomat. Link: https://thediplomat.com/2023/09/china-boosts-semiconductor-subsidies-as-us-tightens-restrictions/
Economic Development Board Singapore (EDB). 2022a. ‘Southeast Asia’s Rising Semiconductor Fortunes’. Link: https://www.edb.gov.sg/en/business-insights/insights/southeast-asia-s-rising-semiconductor-fortunes.html
Economic Development Board Singapore (EDB). 2022b. ‘Diverse Capabilities, Infrastructure Help Drive Chips Industry in Singapore’. Link: https://www.edb.gov.sg/en/business-insights/insights/diverse-capabilities-infrastructure-help-drive-chips-industry-in-singapore.html
Ing, Lili Yan, and Ivana Markus. 2023. ‘ASEAN in the Global Semiconductor Race’. Fulcrum. ISEAS-Yusof Ishak Institute Publication. Link: https://fulcrum.sg/aseanfocus/asean-in-the-global-semiconductor-race/
Li, Cheng, and Xiuye Zhao. 2023. ‘Renewable energy should not be the next semiconductor in US-China competition.’ Brooking Institution Commentary. Link: https://www.brookings.edu/articles/renewable-energy-should-not-be-the-next-semiconductor-in-us-china-competition/
Lin, Liza, and Karen Hao. 2022. ‘American Executives in Limbo at Chinese Chip Companies After US Ban’. Wall Street Journal. Link: https://www.wsj.com/articles/american-executives-in-limbo-at-chinese-chip-companies-after-u-s-ban-11665912757
Miller, Chris. 2022. Chip War. The Fight for the World’s Most Critical Technology. Scribner Publication.
Nguyen-Quoc, Thang. 2023. ‘The Deglobalization Myth: How Asia’s Supply Chains Are Changing’. Hinrich Foundation Publication. Link: https://www.hinrichfoundation.com/research/wp/trade-and-geopolitics/how-asia-supply-chains-are-changing/
Pangestu, Mari Elka. 2023. ‘Critical Minerals: Challenges for Diversification, Climate Change and Development’. Slide Presentation at Peterson Institute for International Economics Webinar, on 27 April 2023. Link: https://www.piie.com/sites/default/files/2023-04/2025-04-27pangestu-ppt.pdf
Ross, Laura. 2020. ‘Inside the iPhone: How Apple Sources from 43 Countries Nearly Seamlessly’. Link: https://www.thomasnet.com/insights/iphone-supply-chain/
Shalal, Andrea, and Karen Freifeld. 2023. ‘US starts process to restrict some investment in key tech in China’. Reuters. Link: https://www.reuters.com/technology/us-starts-process-restrict-some-investment-key-tech-china-2023-08-09/
Siqi, Ji. 2024. ‘US Congress considers new legislation to further restrict investment in Chinese tech sectors’. South China Morning Post. Link: https://www.scmp.com/news/china/article/3250360/us-congress-considers-new-legislation-further-restrict-investment-chinese-tech-sectors
The Economist. 2024. ‘How Trump and Biden have failed to cut ties with China’. The Economist. Link: https://www.economist.com/finance-and-economics/2024/02/27/how-trump-and-biden-have-failed-to-cut-ties-with-china
Varas, Antonio, Raj Varadarajan, Jimmy Goodrich, Falan Yinug. 2021. Strengthening the Global Semiconductor Supply Chain in an Uncertain Era. Boston Consulting Group (BCG) and Semiconductor Industry Association (SIA) Publication. Link: https://www.semiconductors.org/wp-content/uploads/2021/05/BCG-x-SIA-Strengthening-the-Global-Semiconductor-Value-Chain-April-2021_1.pdf
ENDNOTES
For endnotes, please refer to the original pdf document.
| ISEAS Perspective is published electronically by: ISEAS – Yusof Ishak Institute 30 Heng Mui Keng Terrace Singapore 119614 Main Tel: (65) 6778 0955 Main Fax: (65) 6778 1735 Get Involved with ISEAS. Please click here: /support/get-involved-with-iseas/ | ISEAS – Yusof Ishak Institute accepts no responsibility for facts presented and views expressed. Responsibility rests exclusively with the individual author or authors. No part of this publication may be reproduced in any form without permission. © Copyright is held by the author or authors of each article. | Editorial Chairman: Choi Shing Kwok Editorial Advisor: Tan Chin Tiong Editorial Committee: Terence Chong, Cassey Lee, Norshahril Saat, and Hoang Thi Ha Managing Editor: Ooi Kee Beng Editors: William Choong, Lee Poh Onn, Lee Sue-Ann, and Ng Kah Meng Comments are welcome and may be sent to the author(s). |